View your sensors and values on a map with real-time data.
Plan
Get a real-time picture to make it easier for you to make a decision.
Monitor
Create custom stations for specific measurement values.
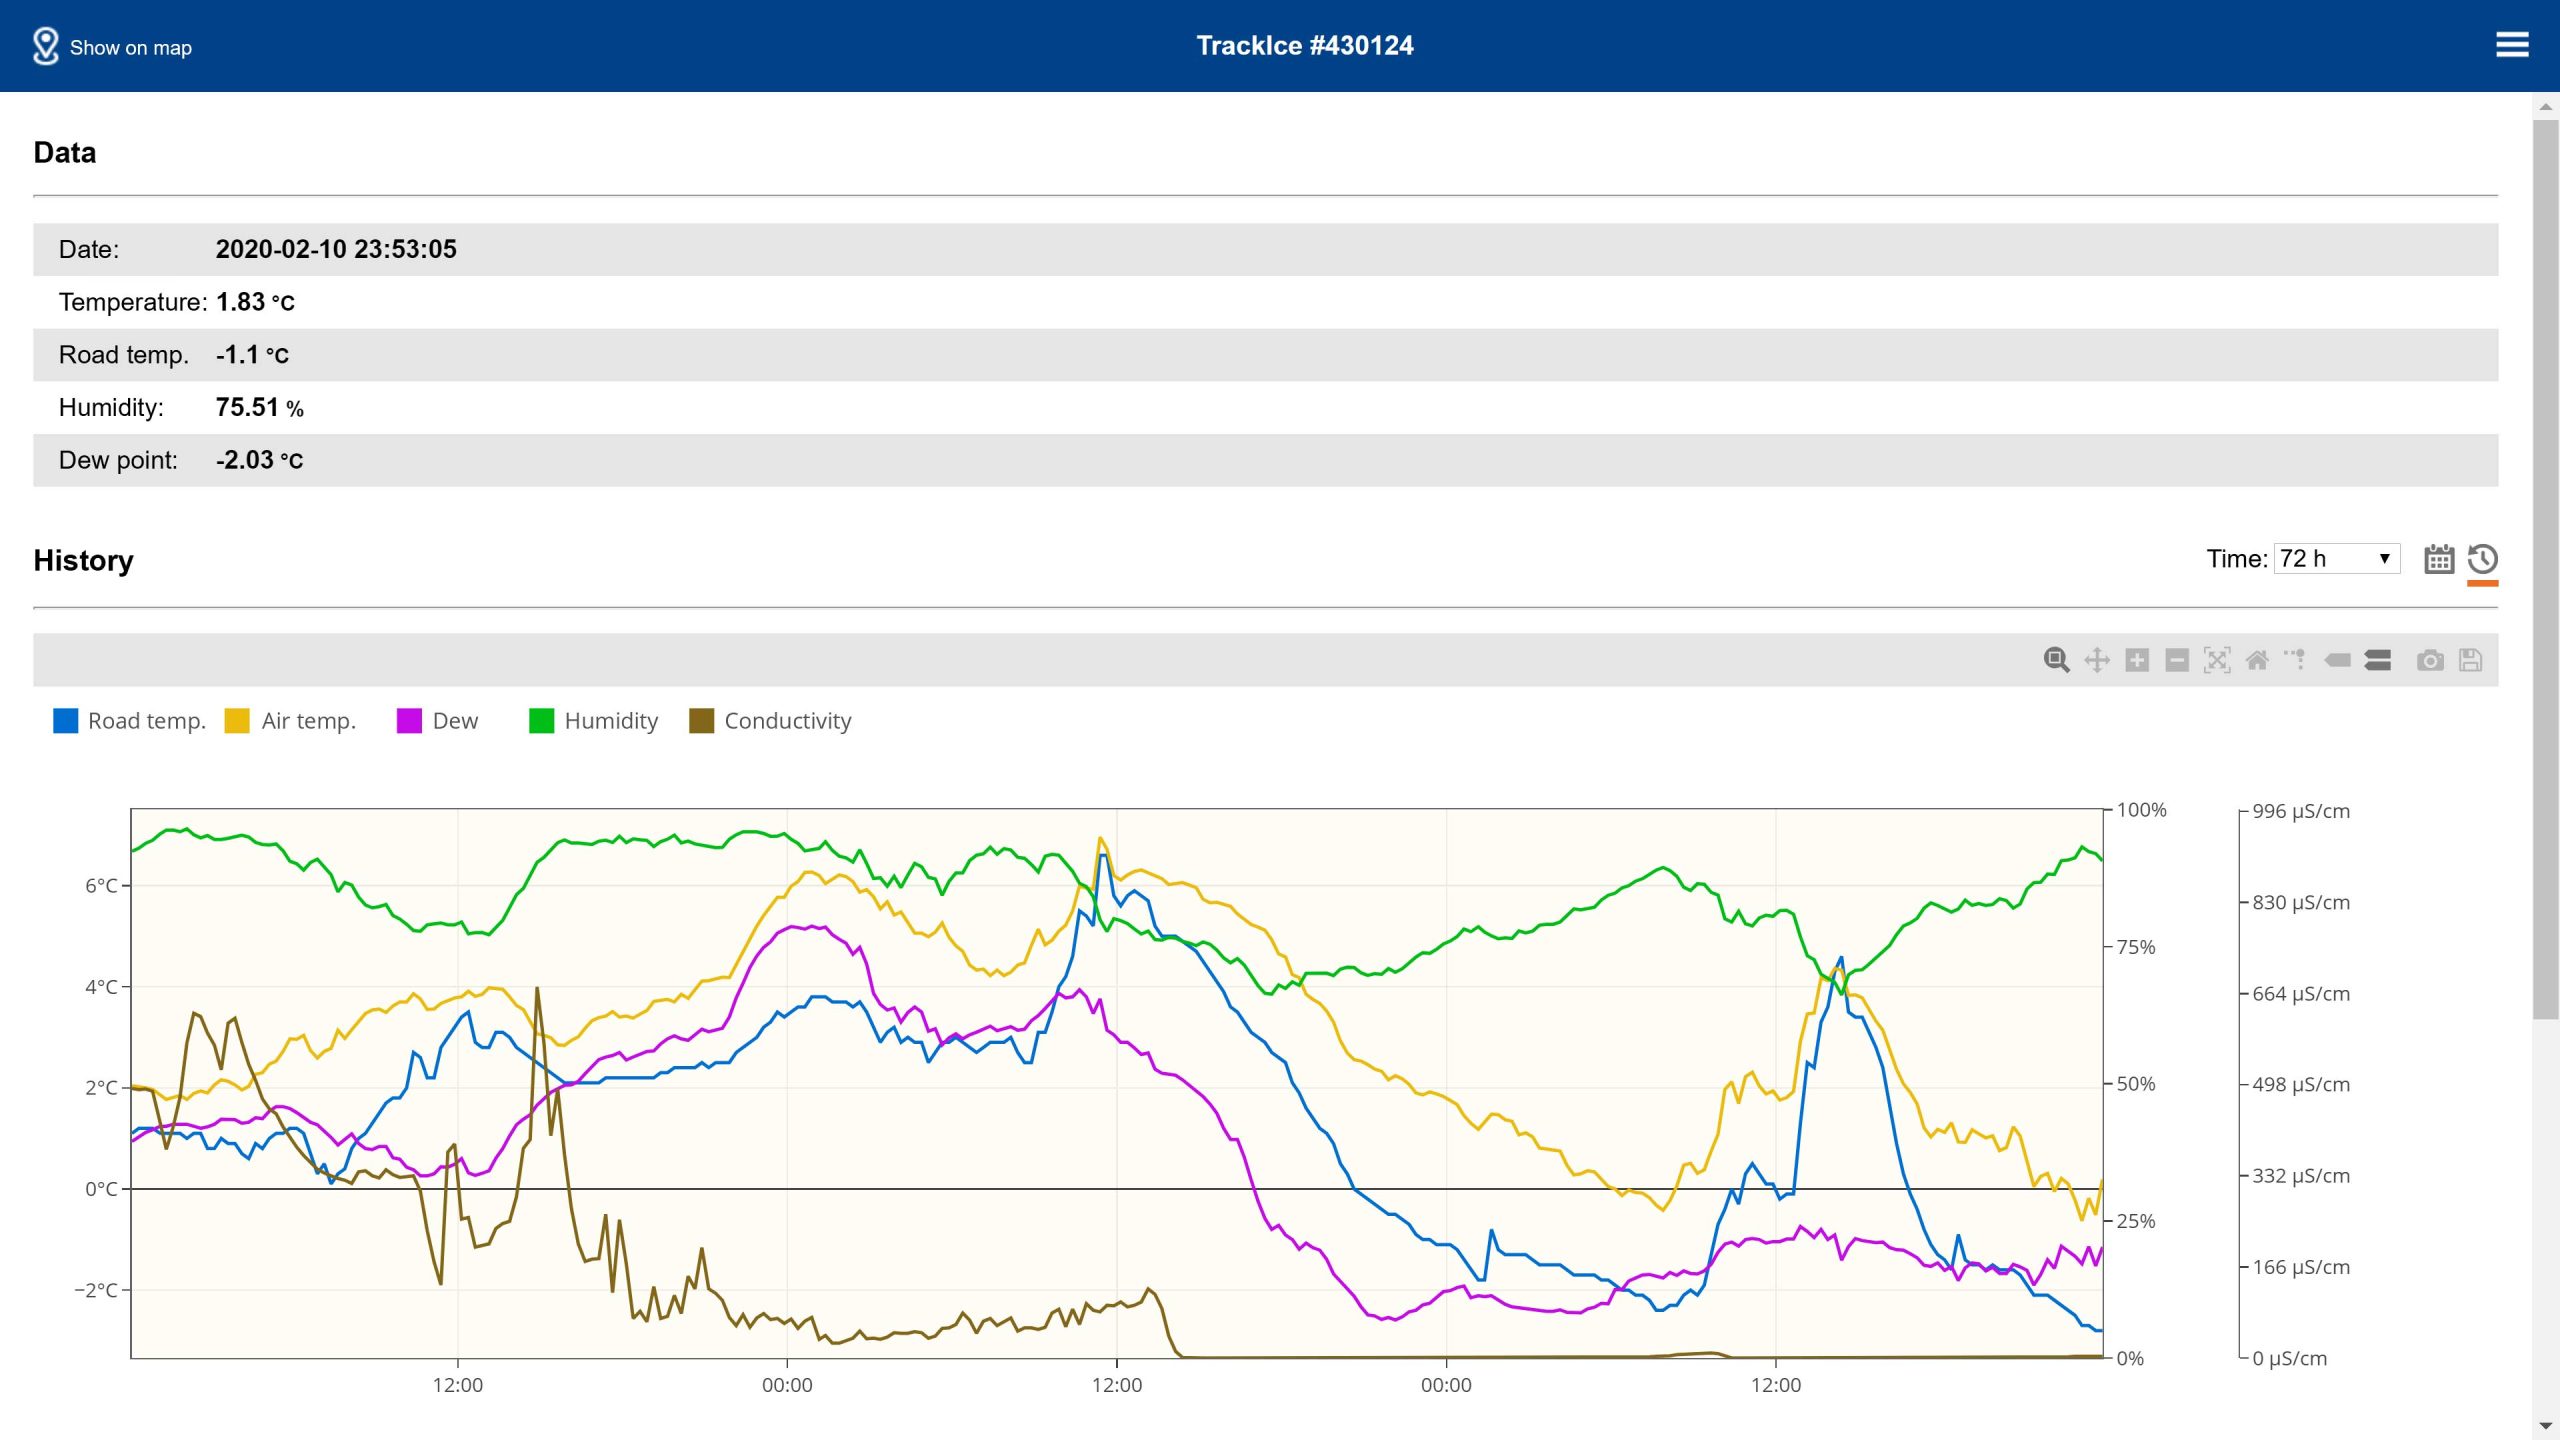
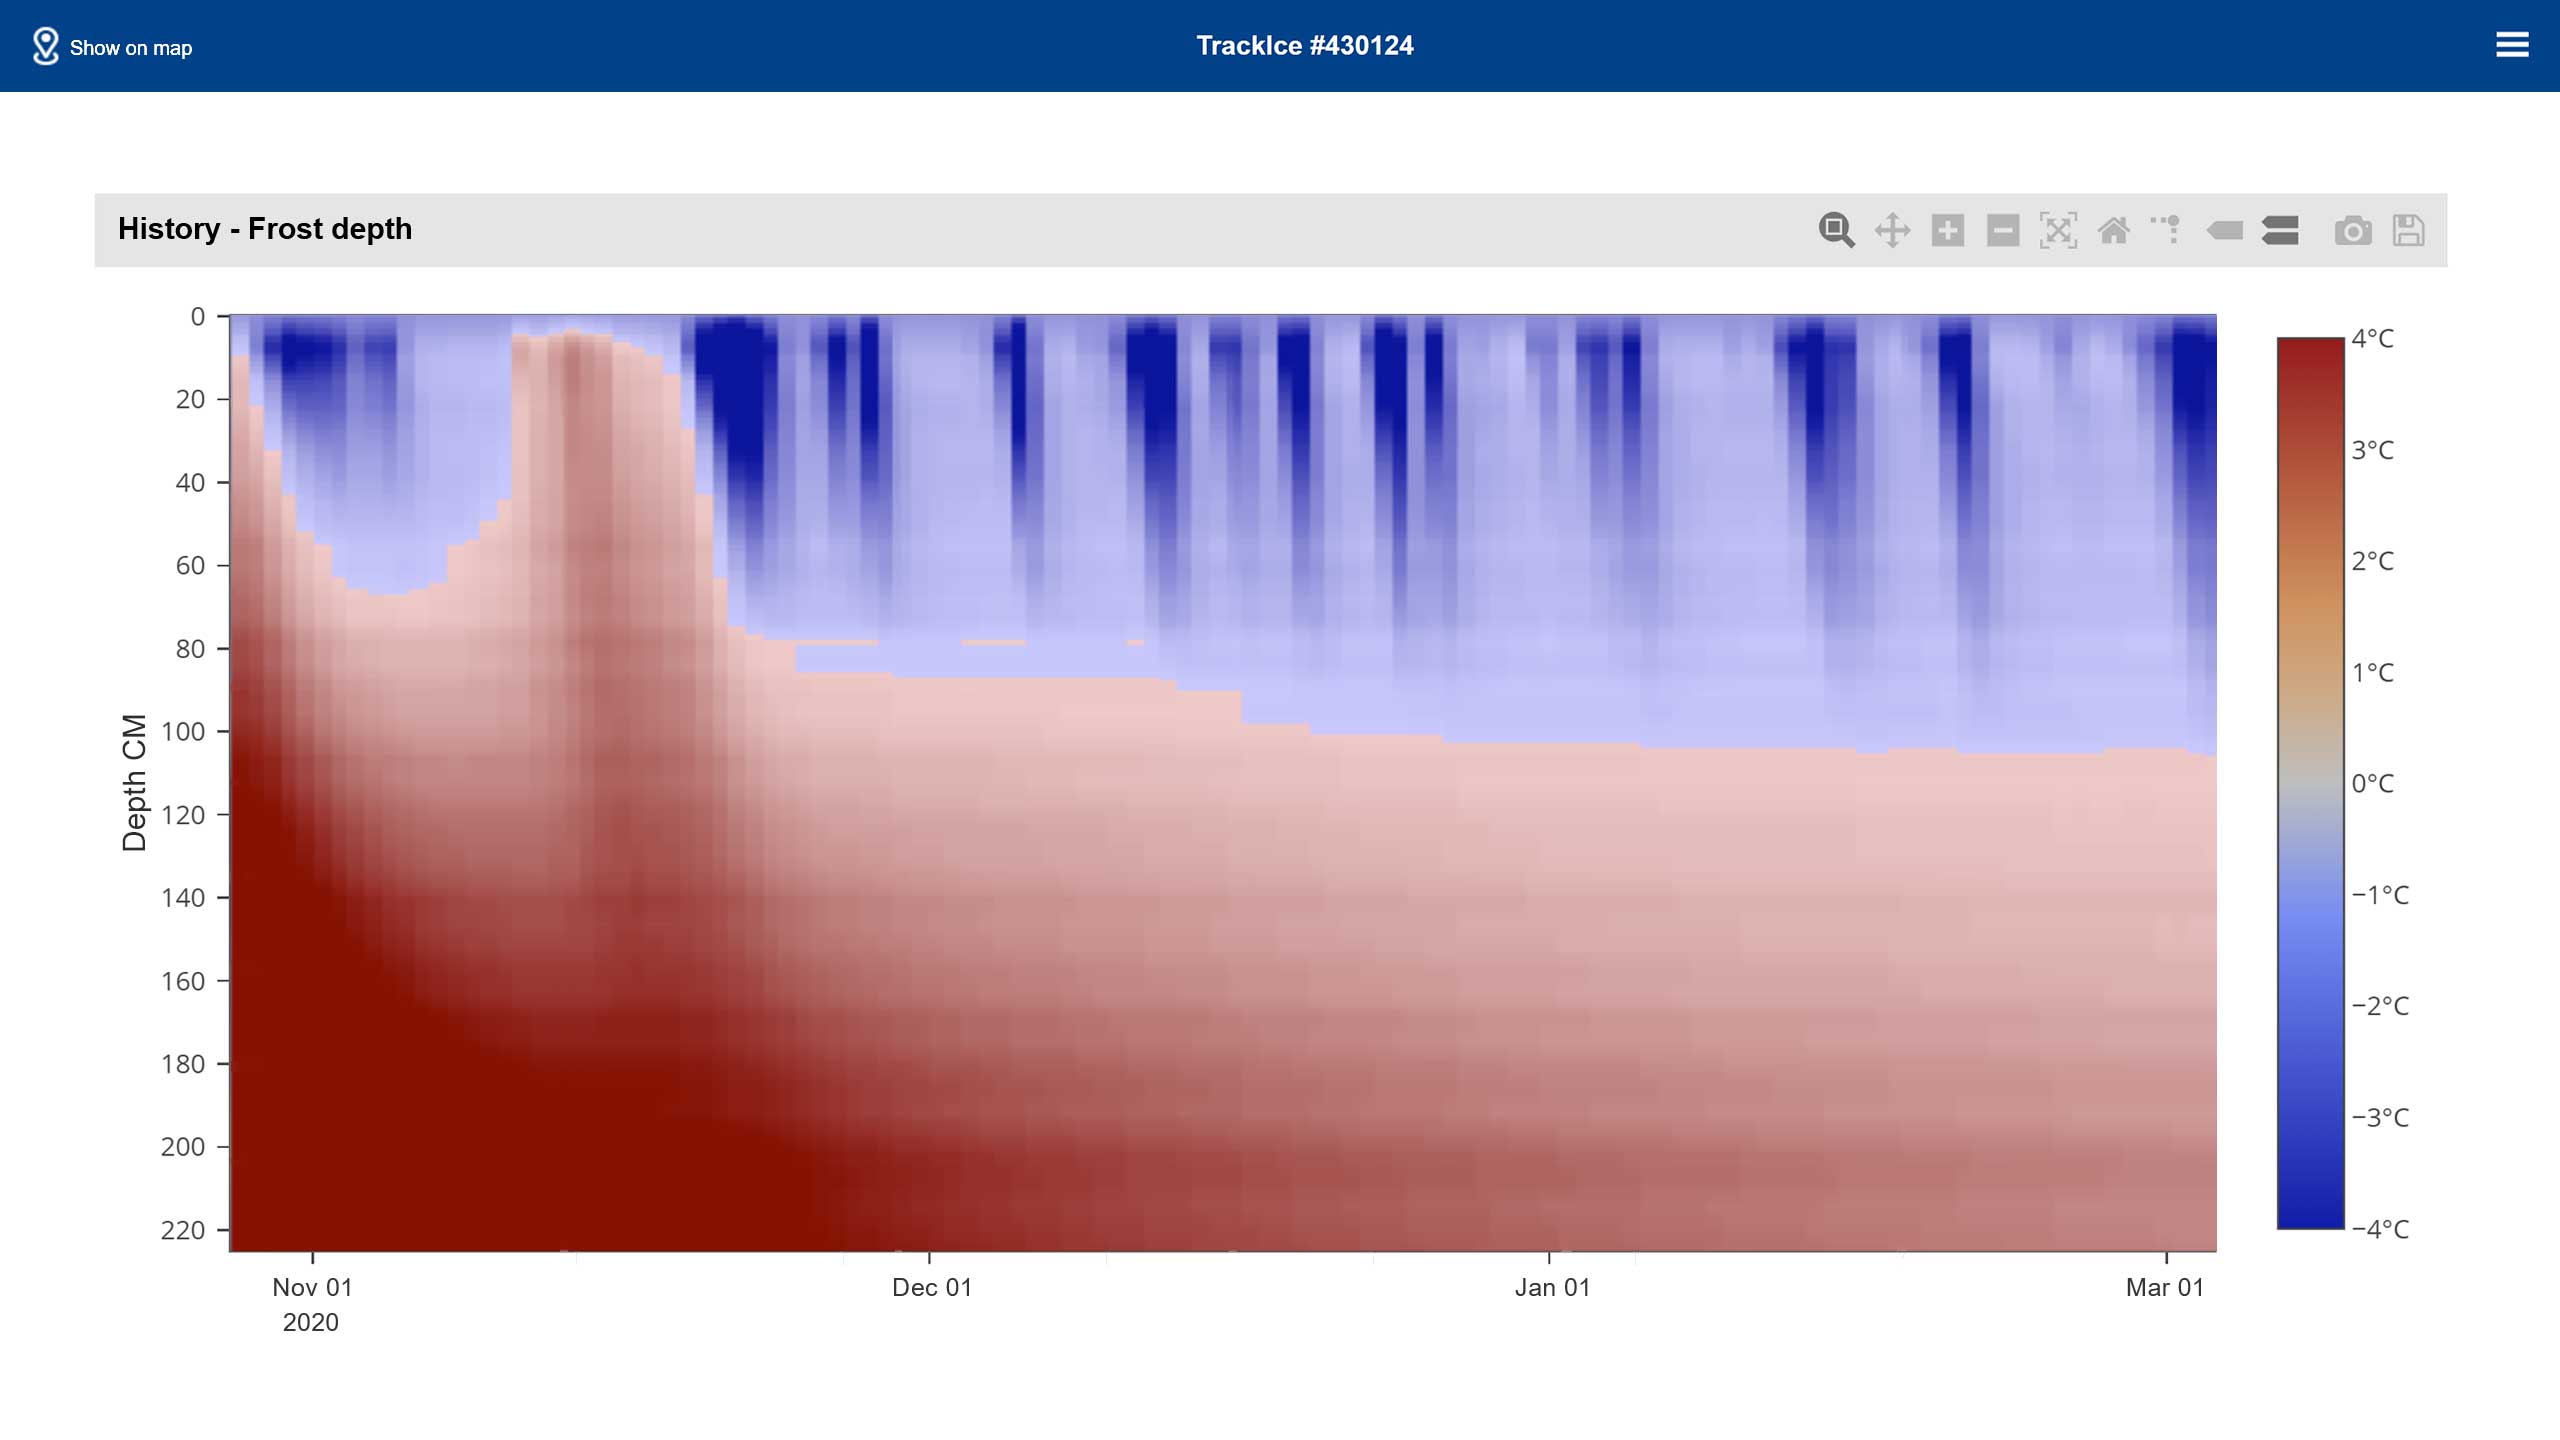
History
See historical values from all your sensors.
Quick overview and forecast
TrackIce can communicate with different types of applications to provide a quick overview and forecast of temperatures, road conditions and its freezing point.
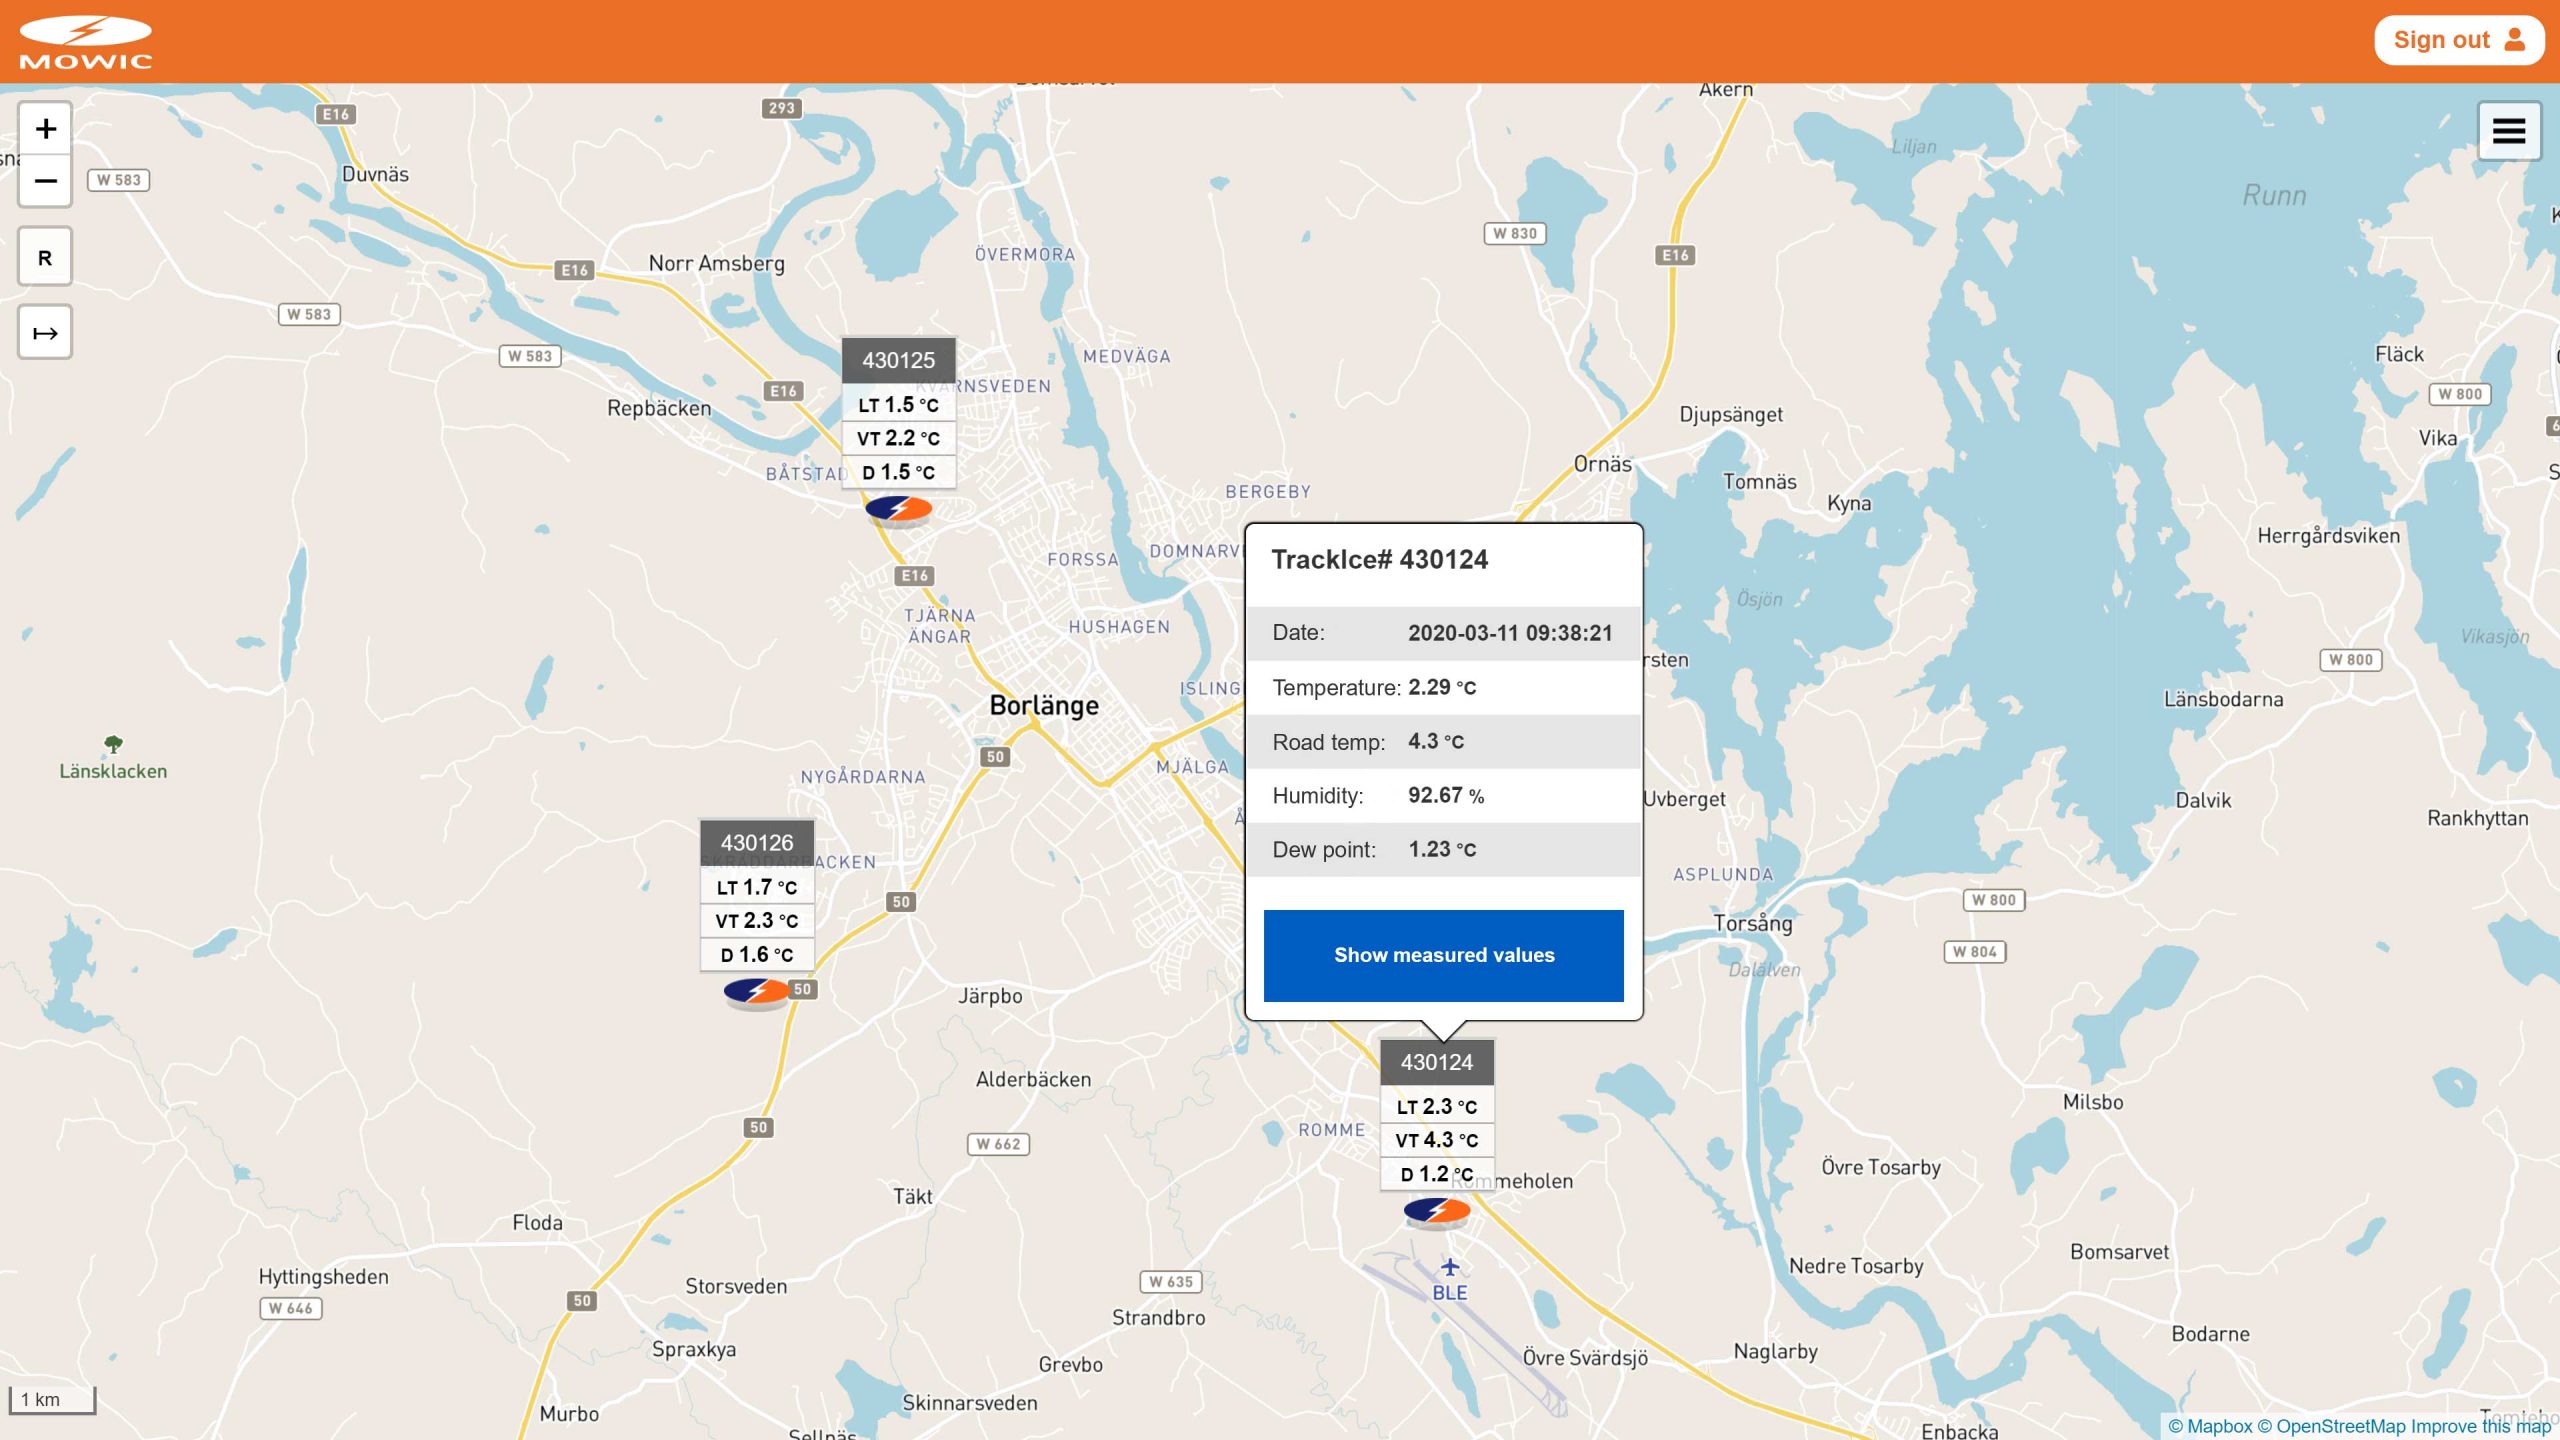
In Mowic Online, you get a real-time picture of your sensors and what it looks like right now, to make it easier to make the decision you need to make. It also gives you access to historical data for a specific location.
Features
Log in to an interface in an accessible web environment.
Map
Location of sensors and measured values.
Measured values
Select a measuring station to see current values and history.
Chart
Sensors can have different diagrams. Shallow depth is shown here.